Project description
Smart City Dashboard
THE DASHBOARD FRAMEWORK POWERED BY EDAG
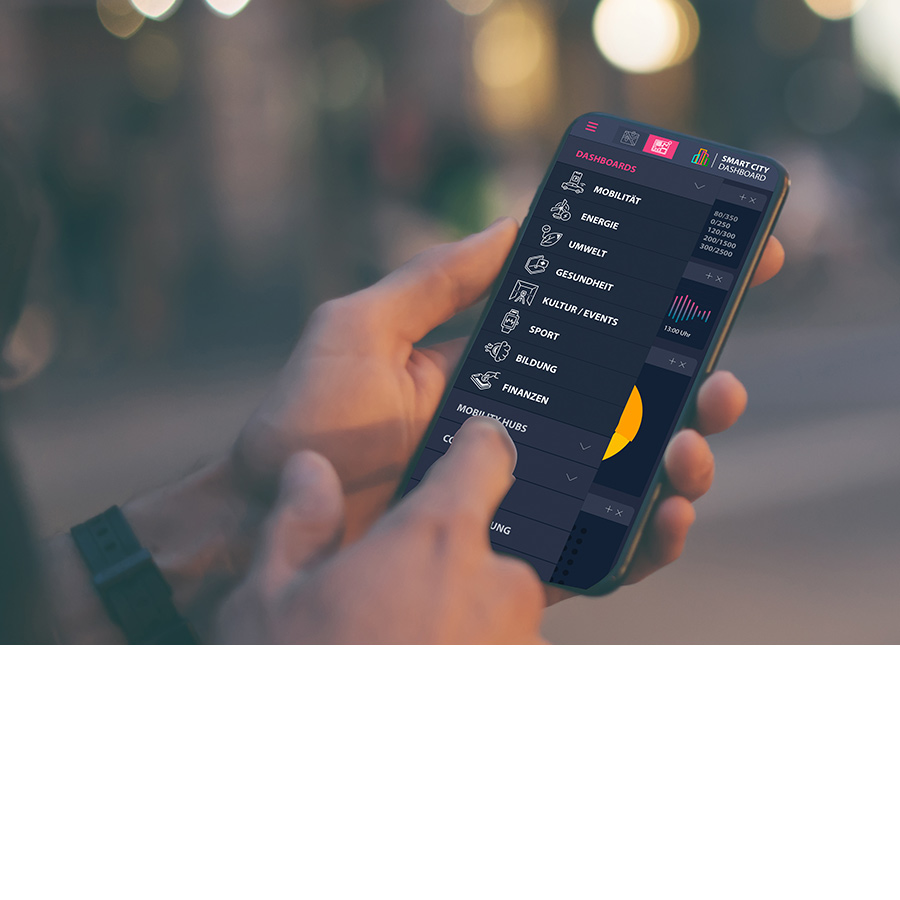
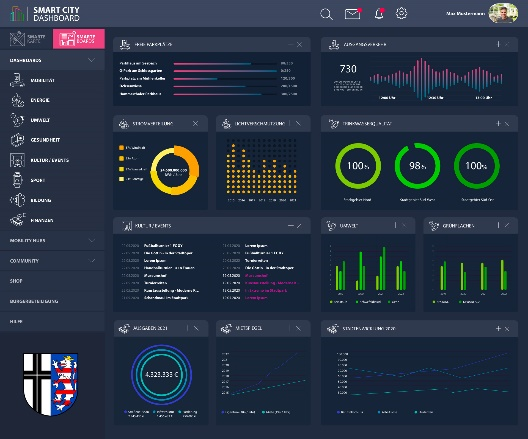
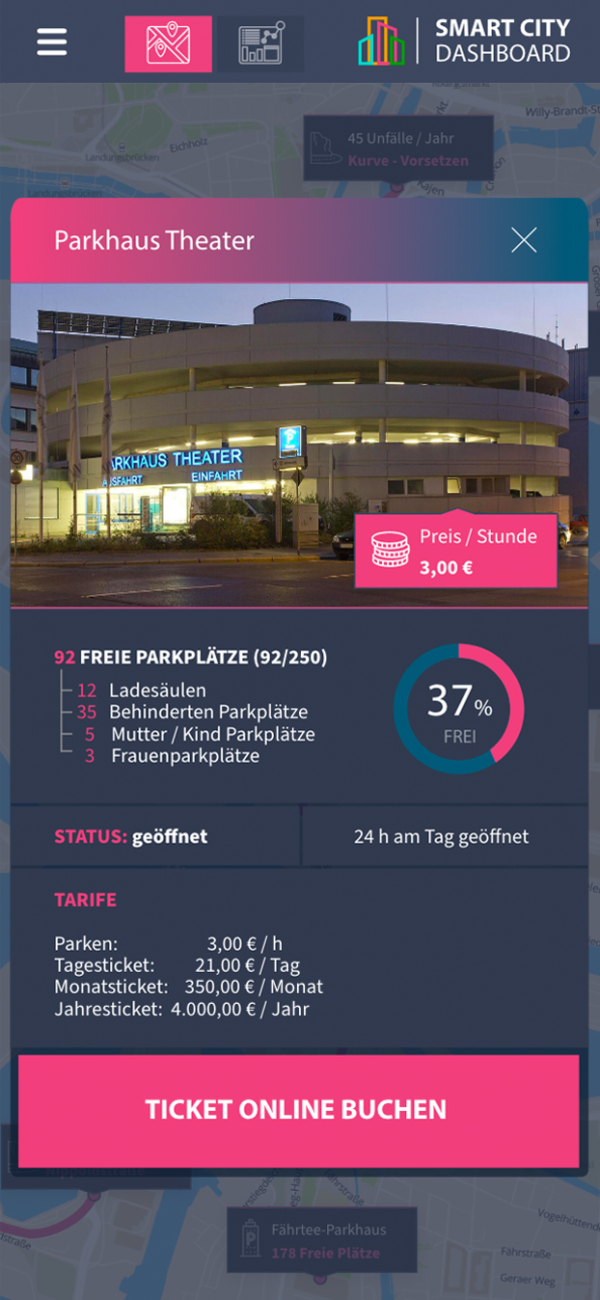
In order to be able to analyze and process the collected data in cities, it helps to display them visually on a dashboard. The data is visualized for the public through a landing page that is configurable in the back office dashboard and graphically displays preselected data sets. From there, users can access the other dashboards “Smart Map” and “Info Cockpits”. Each dashboard can also be accessed directly using its own URL (subdomain).
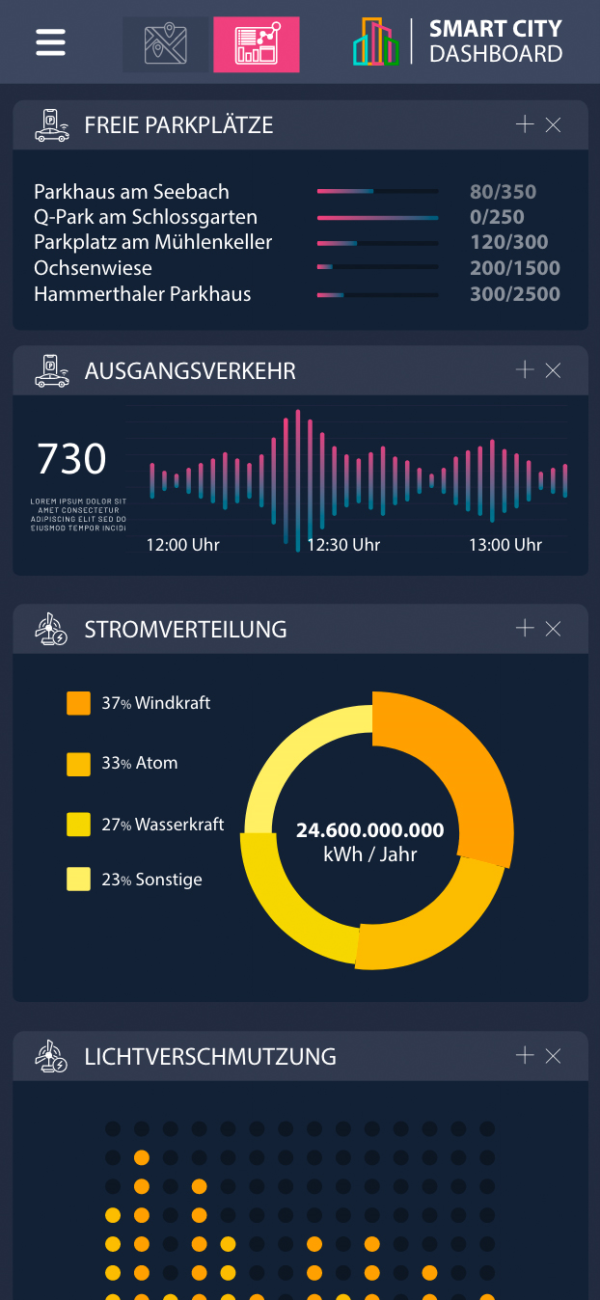
The individual tiles can be configured via the back office dashboard. For example, the Grafana dashboards required in the tender can be integrated. An “importer” ensures that the diagram is displayed on the correct page, and the size can also be defined. The most meaningful KPIs can thus be visualized directly on the start page. Further topic-specific information cockpits can then be created on individual sector sub-pages. In our current example, this is the main topic of mobility:
The use of modern web frameworks such as “React” based on JavaScript ensures that the web applications are also responsive.
TECHNOLOGIE STACK DASHBOARD FRAMEWORKS
The framework consists of a frontend and a backend. The frontend visualizes the data it receives from the backend. The backend obtains the data from the open data platform using an intelligent polling mechanism and stores it temporarily, which keeps the load on the platform to a minimum. The following technologies are used for this, all of which were developed on an OpenSource basis and are state of the art:
Frontend – React Web App
Communicates only with a central backend, the Orion Context Broker, via the NGSI-v2 REST API
Core backend (powered by FIWARE)
Orion Context Broker uses NGSI-v2 REST API for data transfers
External services
All services communicate with only one central backend, the Orion Context Broker, via the NGSI-v2 REST API
OUT-OF-THE-BOX FEATURES DASHBOARD FRAMEWORKS
1. Creation and management of panels
2. Configuration of the menu
3. The wizard – no-code visualization options
BUSINESS MODEL SMART CITY DASHBOARD
![]()
SETUP
one-time
Initialization, customization, deployment
![]()
OPERATION
recurring
Operation, maintenance, update management
![]()
FEATURE ENHANCEMENTS
one-time
Further development/feature extension
ROADMAP SMART CITY DASHBOARD
The open source power
Further development of the software through “Public Money, Public code” projects and low operating costs.

SMART GOVERNMENT – WHO TO CONTACT

Karina Schäfer
Business Development & Sales
EDAG Group
THIS MIGHT ALSO INTEREST YOU

trive.park
Project description TRIVE.PARK DEVELOPMENT AND OPERATION OF A SMART PARKING [...]

Youth taxi app
Project description ON DEMAND YOUTH TAXI APP CONCEPTION AND DESIGN [...]

EDAG Citybot AI prototype
Project description EDAG CITYBOT KI PROTOTYPE A MULTIFUNCTIONAL, FULLY AUTONOMOUS, [...]
