Project description
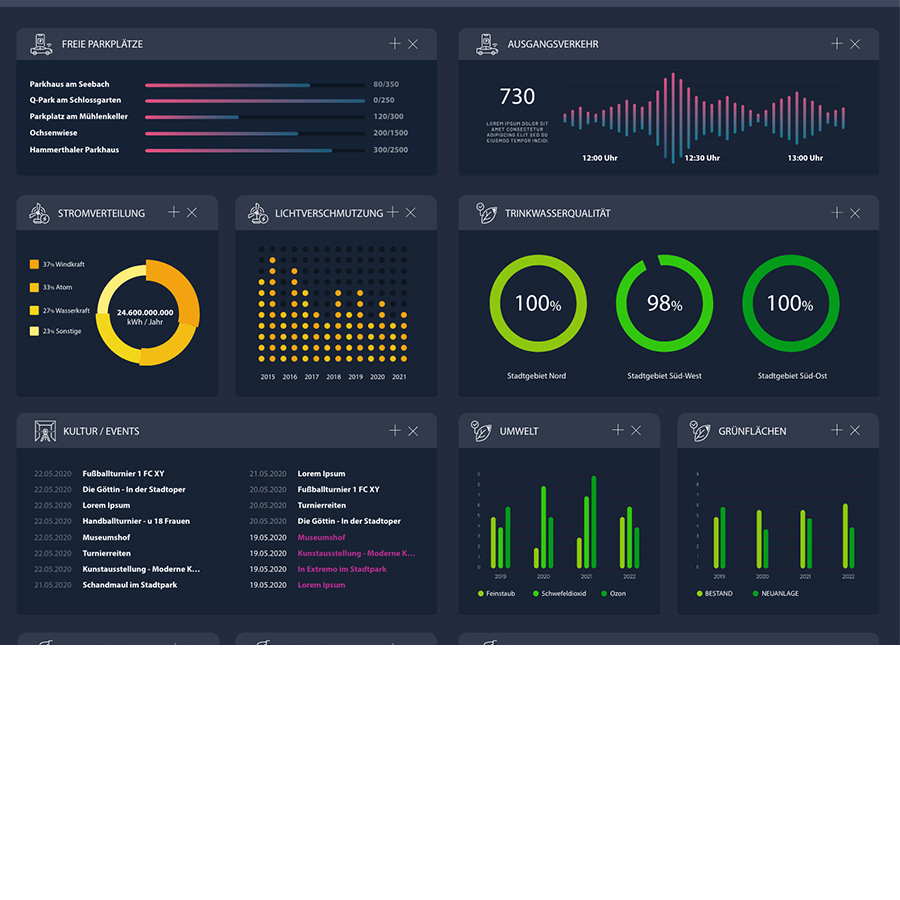
Dashboard Framework
Visualization of Urban Data Platforms
Description
Development and maintenance of a smart city dashboard for all citizens of a city. Divided into different sectors like mobility, energy, environment and many more, sensor data, KPIs and static data are presented in understandable graphics and on a map. Cities can independently customize the user front-end via an additional back-office dashboard.
Solution approach
Development and operation of an open source software as well as connection to existing Urban Data Platforms powered by FIWARE.
Technical focus
- UX strategy and USP definition
- Development and styling of a self-explanatory, responsive and low barrier user interface design with Adobe XD
- Derivation of a style guide
- Frontend development for user dashboard based on open source software (React WebApp)
- Frontend development for backoffice dashboard (React WebApp)
- Development of a CI/CD pipeline

Smart Infrastructure – who to contact

Karina Schäfer
Business Development & Sales
EDAG Group
THIS MIGHT ALSO INTEREST YOU
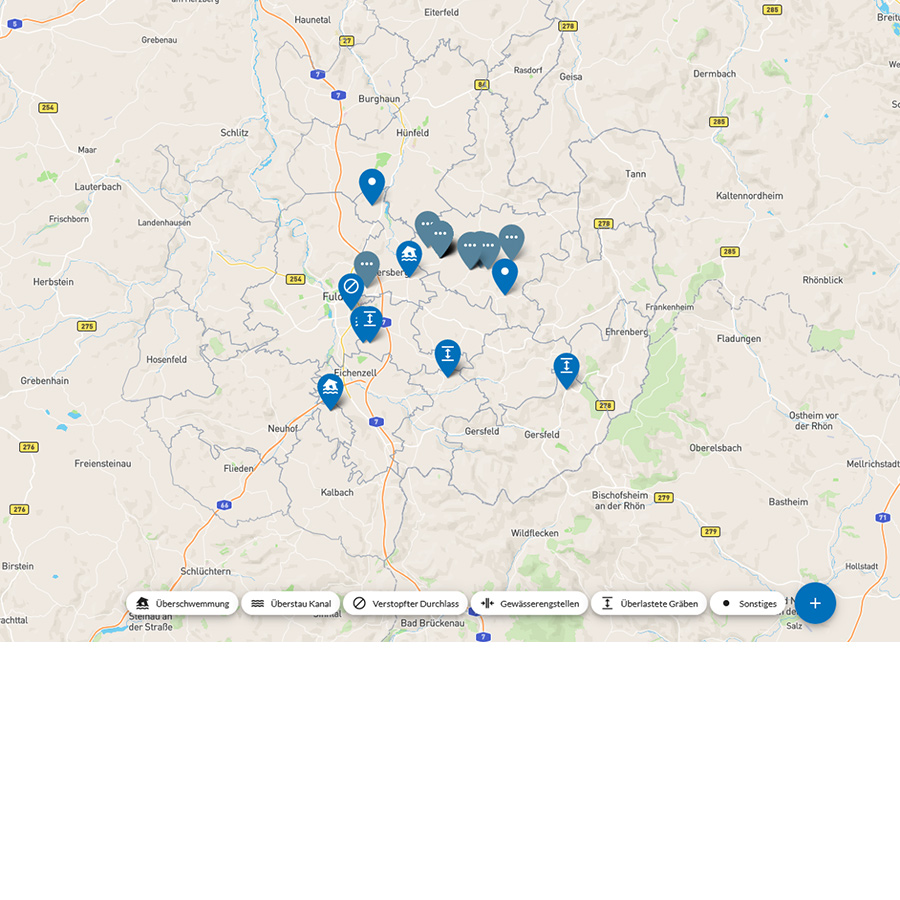
Early Warning System for Heavy Rainfall
Project description Early Warning System for Heavy Rainfall Advisory [...]
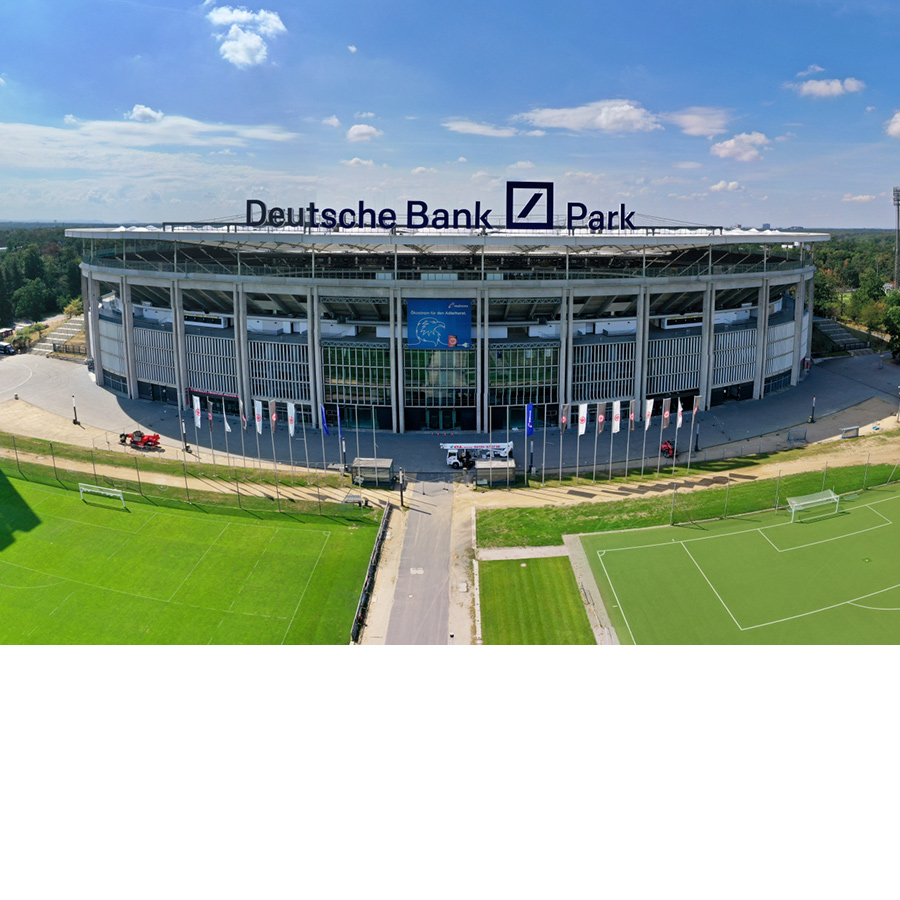
Conceptual Design of Mobility Hubs in and around Eichenzell
Project description Conceptual Design of Mobility Hubs in and around [...]
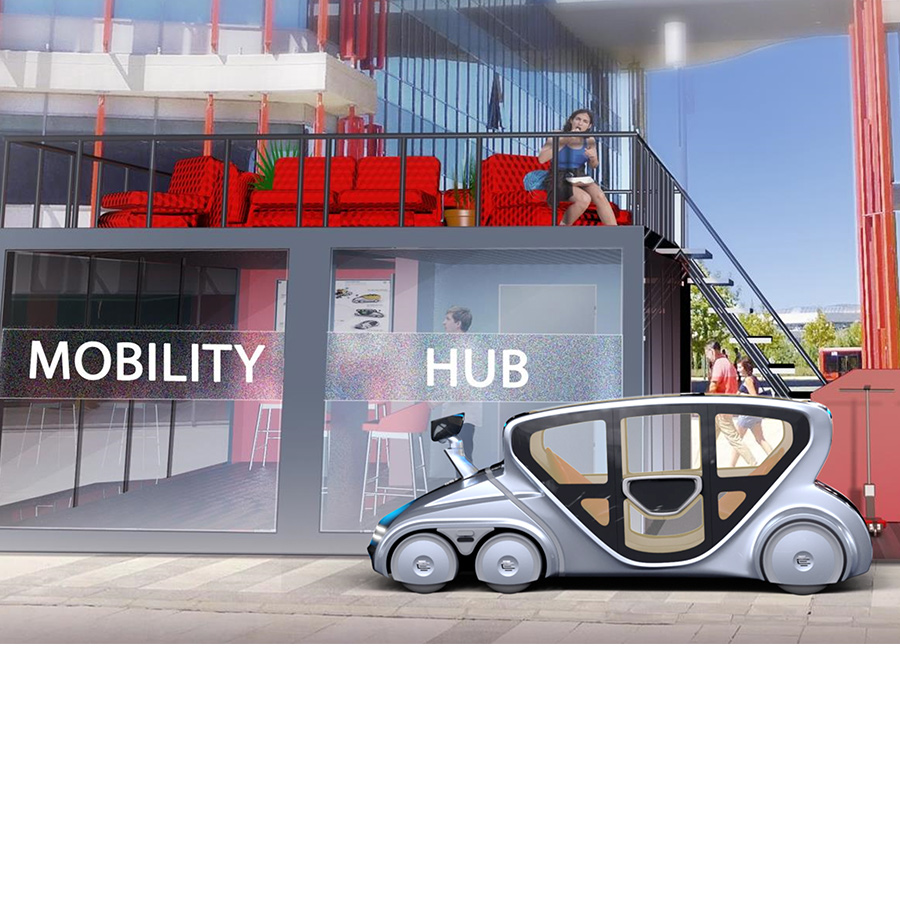
Campus FreeCity
Project description Campus FreeCity MOBILITY PLATFORM Description Planning, development and [...]
